
A common question from devs evaluating monitoring tools: "what does the actual flow look like, from my code breaking to me knowing about it?"
Fair question. Here's the whole loop with real code and real screenshots.
The setup
A minimal Express app with one route that intentionally breaks:
const express = require("express");
const pingoni = require("pingoni");
const app = express();
app.use(pingoni(process.env.PINGONI_API_KEY));
app.post("/api/v1/billing/subscribe", (req, res) => {
throw new Error("Stripe API timeout: request to https://api.stripe.com/v1/subscriptions failed after 30000ms");
});
app.use(pingoni.errorHandler(process.env.PINGONI_API_KEY));
app.listen(3000);
```
Three lines added vs a vanilla Express app: the `require`, the middleware mount, the error handler. That's the entire integration.
## When the route fires
A request comes in:
```bash
curl -X POST http://localhost:3000/api/v1/billing/subscribe
```
Three things happen in sequence:
1. The request gets captured. Method, path, timestamp, response time. Logged before the error even fires, because the middleware mounted first.
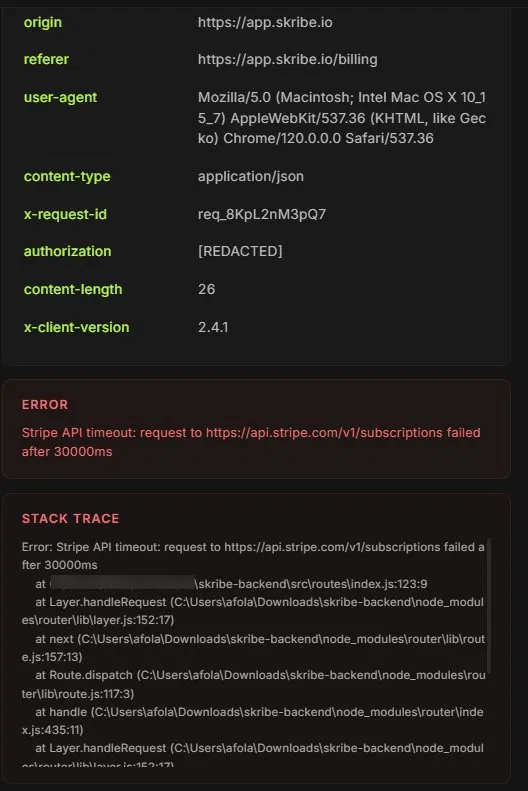
2. The error gets caught by `pingoni.errorHandler`. Stack trace, the request that caused it, the error message — all captured automatically.
3. The dashboard updates within seconds. No polling, no manual refresh.
## What shows up in the dashboard
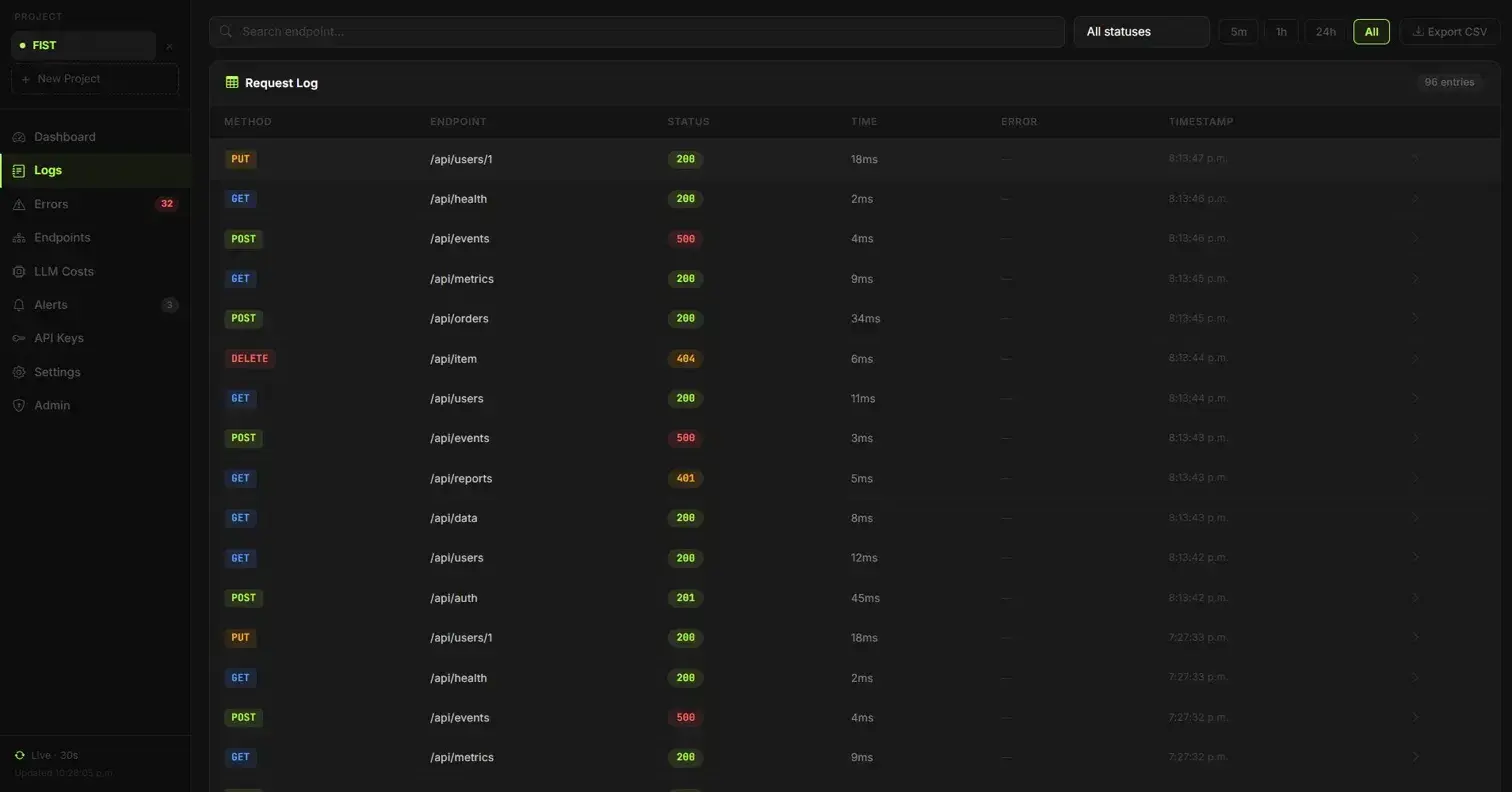
The Logs view shows the new entry within ~2-5 seconds of the request landing:
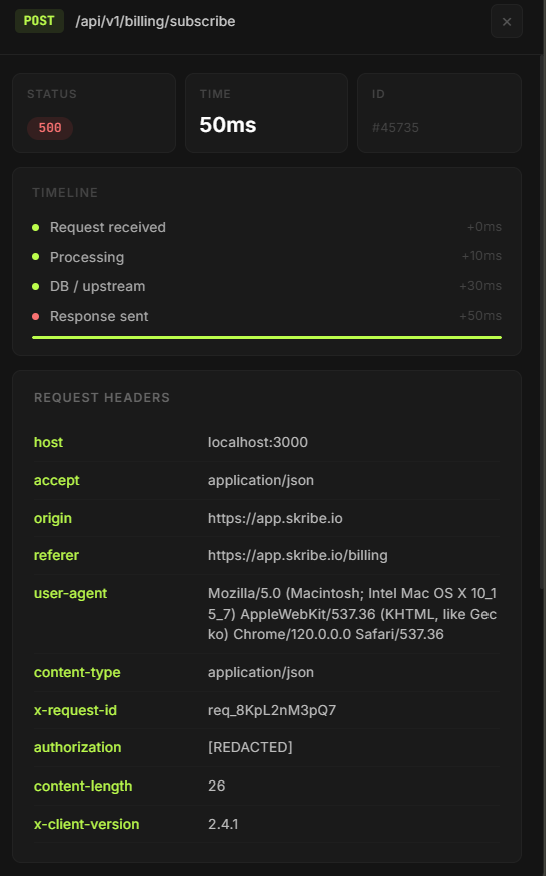
Click into it and you get the full detail panel — stack trace, request headers, timing breakdown:
The timeline shows where in the request the failure happened (request received, processing, DB/upstream, response sent). For this error, everything happened in 50ms because the route threw quickly — useful when triaging whether a slow request was your code or a downstream service.
## The alert
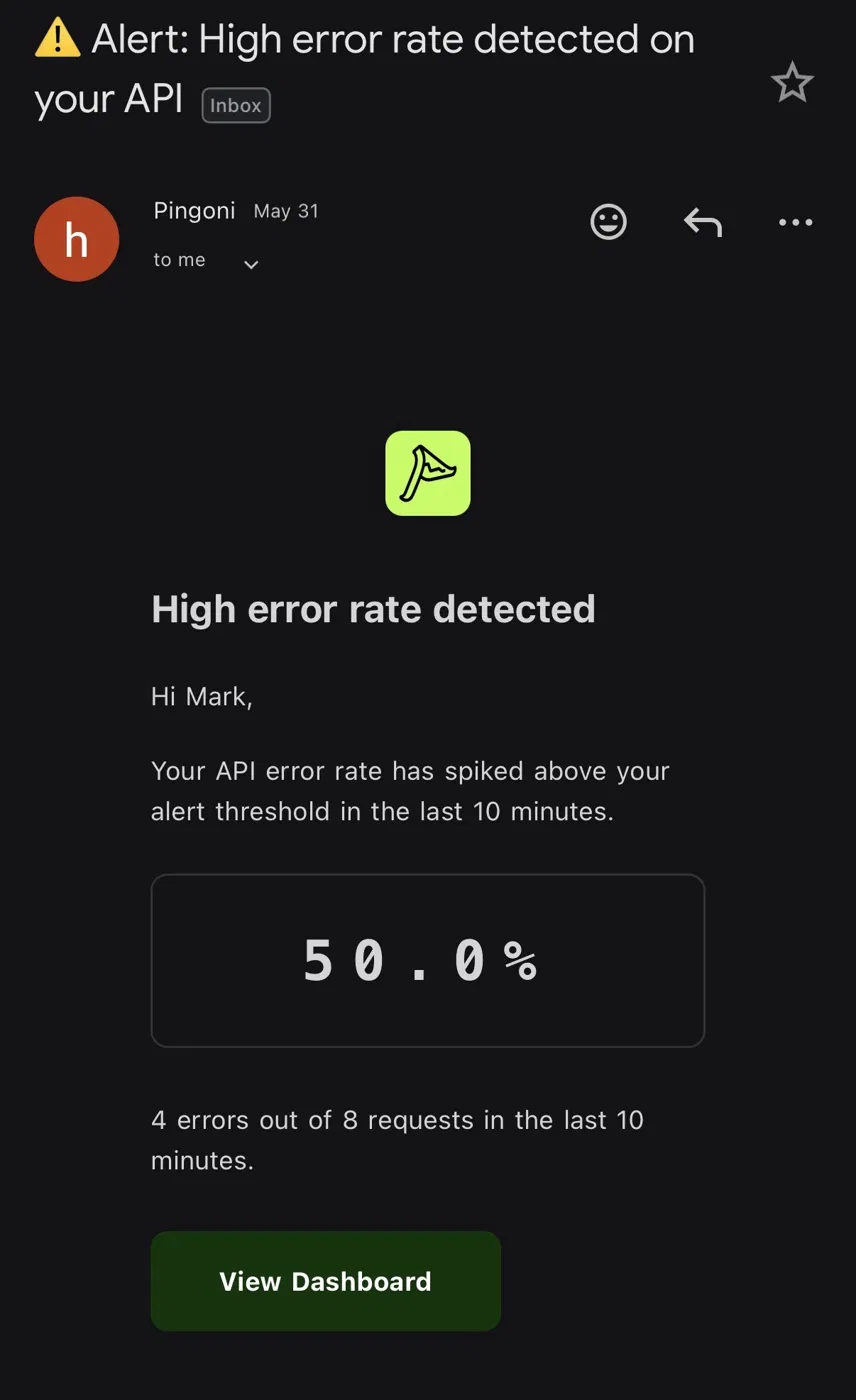
If email alerts are enabled and you've crossed your error rate threshold, an email arrives within a few seconds:
## Total time, code to alert
In testing on a Railway-deployed Node app:
- Request hits the endpoint: 0ms
- Pingoni captures and processes: ~200ms
- Dashboard reflects it: ~2-5 seconds
- Email alert: ~5-10 seconds
So from "your code broke" to "you got pinged" is under 10 seconds, end to end. No polling. No manual page refresh.
## Why this matters
The most common reason devs roll their own monitoring is they don't trust a black-box tool to actually capture what matters. Walking through the entire loop with real code and real screenshots is how you decide if a tool is doing what it says.
If you want to try this yourself: free tier at [pingoni.com](https://www.pingoni.com), 10,000 requests/month, no credit card needed. The example above is the entire integration — copy it into a fresh Express app and you'll see your first event in the dashboard within a minute.

Top comments (0)